Virtual Staging Statistics 2026: Market Data + 10,000 AI Stagings
Sep 8, 2026 · 12 min read
Virtual staging statistics for 2026: NAR, RESA and Zillow market data plus what more than 10,000 AI stagings on RoomLift reveal about styles, rooms and edits.
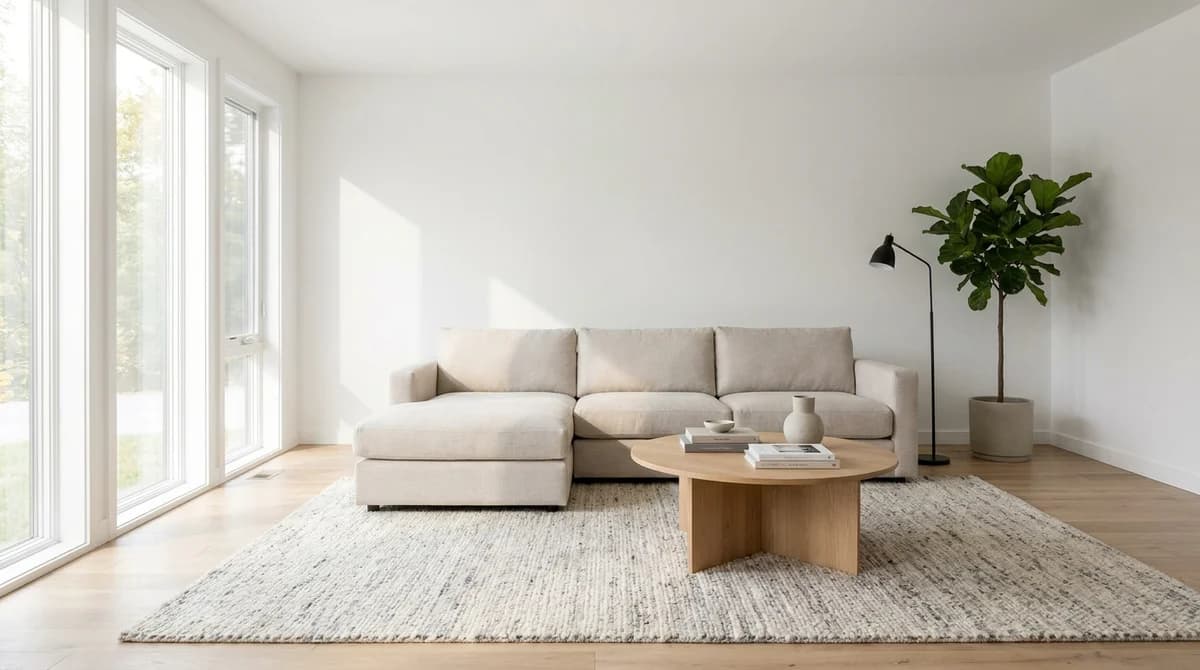
Virtual staging statistics for 2026 agree from two directions. Market research from NAR, RESA and Zillow shows staging and strong photos change what buyers offer and how fast they act. RoomLift platform data from more than 10,000 AI stagings shows what people order: Modern and Scandinavian styles, living rooms and bedrooms, and decluttering above every other edit.
Key virtual staging statistics for 2026
Use this block as a quick reference. Market figures come from published research. Platform figures are RoomLift platform data covering more than 10,000 AI-generated images and videos in the 12 months to September 2026.
- 81% of buyers say staging makes it easier to picture a property as their own (NAR Profile of Home Staging).
- 23% of buyer's agents reported a 1-5% increase in the dollar value offered for staged homes, and 18% reported 6-10% (NAR Profile of Home Staging).
- 46% of buyer's agents say the living room is the most important room to stage (NAR Profile of Home Staging).
- Staged homes sell for 1-5% more on average, and in some markets spend 33-50% fewer days on market (RESA).
- 97% of home buyers search for properties online, and photos are the primary factor in deciding whether to request a showing (NAR).
- Listings with high-quality photos sell up to 32% faster, and listings with 22-27 photos get the most buyer engagement (Zillow research).
- Listings with floor plans receive 30% more engagement than those without (RICS).
- Modern (31%) and Scandinavian (29%) account for 60% of all staging requests (RoomLift platform data).
- Living rooms (30%) and bedrooms (29%) make up 59% of staged rooms (RoomLift platform data).
- Declutter is the most requested photo edit at 28% of edit requests, ahead of add realism, golden hour and virtual twilight at 13% each (RoomLift platform data).
- Property developers generate roughly 9x more images per active user than homeowners and about 6x more than real estate agents (RoomLift platform data).
- AI virtual staging costs about $1-5 per image and takes under 60 seconds, against $200-500 for a traditional render (RoomLift).
What does the market data say about home staging?
The most cited home staging statistics for 2026 come from the National Association of Realtors. In NAR's Profile of Home Staging, 81% of buyers say staging makes it easier to picture a property as their own. The report also tracks money: 23% of buyer's agents reported a 1-5% increase in the dollar value offered for staged homes, and 18% reported an increase of 6-10%.
NAR also asks which room matters most. 46% of buyer's agents say the living room is the most important room to stage. In NAR's 2025 edition, the living room was also the most commonly staged room (91%), followed by the primary bedroom (83%) and the dining room (69%).
The Real Estate Staging Association (RESA) reports the sale-side effect. According to RESA, staged homes sell for 1-5% more on average, and in some markets staged homes spend 33-50% fewer days on market. On a $400,000 listing, a 1-5% lift is $4,000 to $20,000. For a closer look at what the time-on-market claims do and don't prove, see do staged homes sell faster.
Photos decide whether staging gets seen at all. NAR reports 97% of home buyers search for properties online, and photos are the primary factor in deciding whether to request a showing. Zillow research adds that listings with high-quality photos sell up to 32% faster, and that listings with 22-27 photos get the most buyer engagement. Two adjacent numbers complete the picture. RICS reports that listings with floor plans receive 30% more engagement than those without. Wyzowl's State of Video Marketing finds 91% of businesses use video as a marketing tool, and 85% of consumers say a video convinced them to buy.
What do more than 10,000 AI stagings show?
Market surveys ask what people believe. Platform data shows what they do. The figures in this section are RoomLift platform data: the share of generations where the relevant field was set, across more than 10,000 AI-generated images and videos in the 12 months to September 2026.
Which staging styles are most popular?
Two styles dominate. Modern takes 31% of staging requests and Scandinavian 29%, so together they cover 60% of everything staged on RoomLift. The next tier is Japandi at 11% and Urban Chic at 10%.
| Style | Share of staging requests (RoomLift platform data) |
|---|---|
| Modern | 31% |
| Scandinavian | 29% |
| Japandi | 11% |
| Urban Chic | 10% |
| Boho | 7% |
| Traditional | 6% |
| Industrial | 4% |
| French | 3% |
Percentages are rounded, which is why the column adds up to slightly more than 100%.
The lesson for anyone choosing a default: light, neutral and uncluttered wins. Modern, Scandinavian and Japandi share pale palettes, simple furniture and plenty of visible floor, and between them they account for 71% of requests (RoomLift platform data). Traditional (6%), Industrial (4%) and French (3%) still get ordered, but usually for a specific property rather than as a default. If you're deciding between the two lightest looks, our Japandi vs Scandinavian comparison covers the differences.
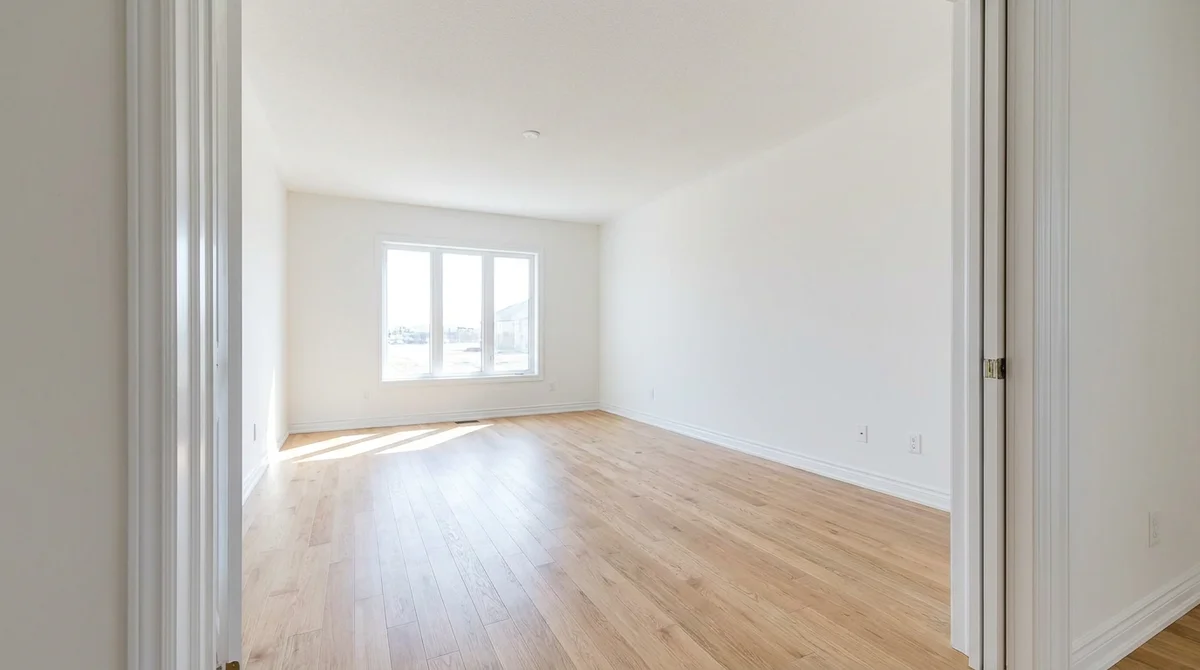
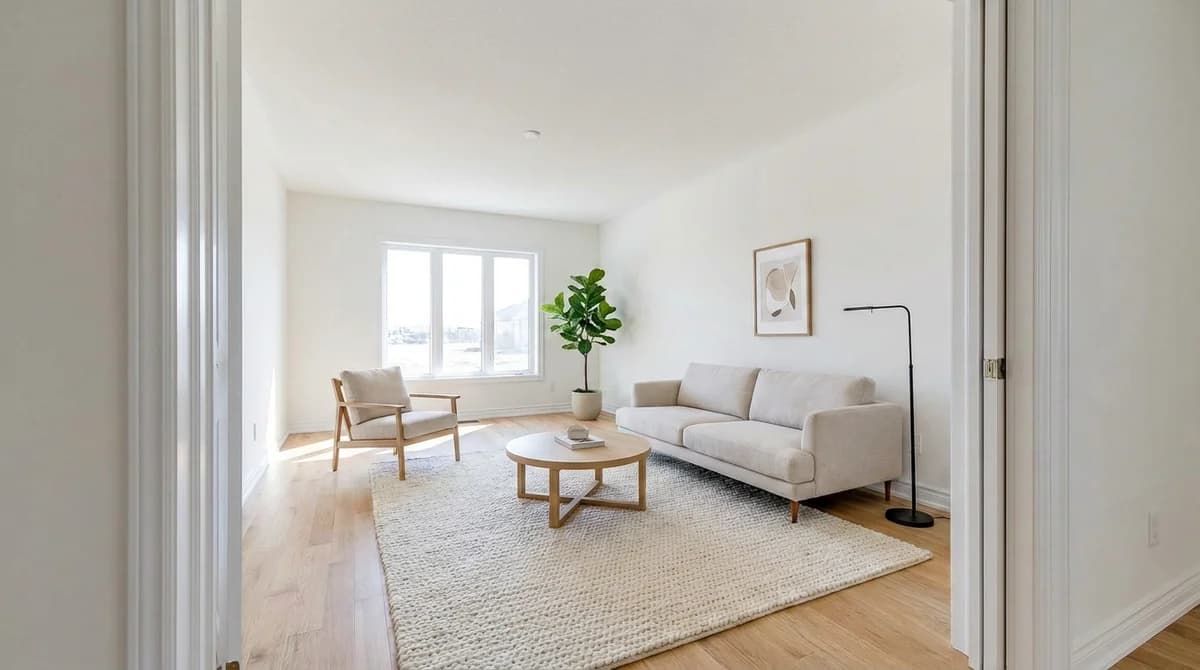
Here is the most requested pairing in practice: an empty living room, then the same room staged in Scandinavian style.
Which rooms get virtually staged most?
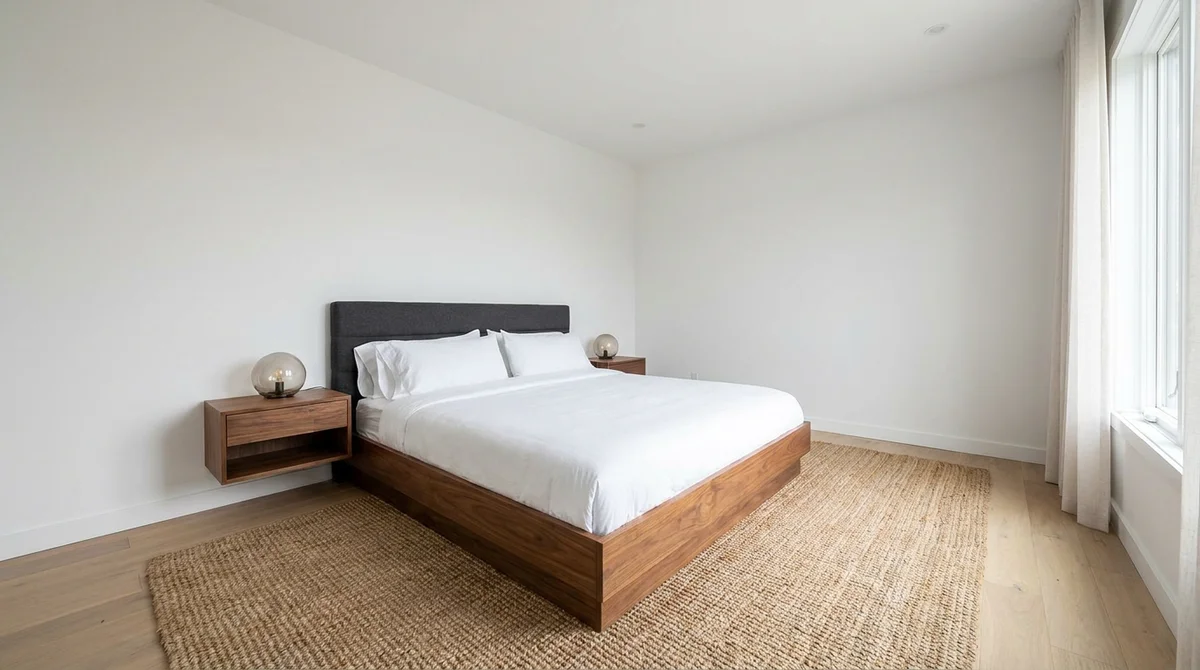
Living rooms and bedrooms are 59% of all staged rooms (RoomLift platform data): living room 30%, bedroom 29%. Kitchen is a distant third at 10%. That order matches the NAR survey closely. 46% of buyer's agents call the living room the most important room to stage, and in NAR's 2025 Profile of Home Staging the living room (91%) and primary bedroom (83%) were the two most commonly staged rooms.
| Room | Share of staged rooms (RoomLift platform data) |
|---|---|
| Living room | 30% |
| Bedroom | 29% |
| Kitchen | 10% |
| Open-concept | 6% |
| Great room | 6% |
| Bathroom | 5% |
| Home office | 5% |
| Dining room | 4% |
| Entryway | 3% |
| Master suite | 2% |
One difference stands out. Dining rooms are the third most commonly staged room in NAR's survey (69%) but only 4% of AI stagings. Physical stagers bring a table because the buyer will walk through the room. Virtual stagers spend their credits on the rooms that carry the listing photos: living room, bedroom, kitchen.
Which photo edits are in demand?
Staging isn't the only thing people order. Photo Enhance presets show what else agents and photographers fix before a listing goes live (RoomLift platform data):
| Photo edit preset | Share of edit requests (RoomLift platform data) |
|---|---|
| Declutter | 28% |
| Add realism | 13% |
| Golden hour | 13% |
| Virtual twilight | 13% |
| HDR enhance | 12% |
| Add people | 8% |
| Close-up | 6% |
| Sky replacement | 3% |
| Day-to-night | 2% |
Declutter leads at 28%, more than double any other preset. Occupied homes are the everyday case, and removing the owner's belongings is the edit that makes a room photograph like a listing. Light and time-of-day edits are the other big block: golden hour, virtual twilight, HDR enhance and day-to-night together are 40% of edit requests. These are the same presets available through RoomLift's real estate photo editing tools.
How does usage differ by job type and persona?
Interior redesign and staging are 92% of image jobs (RoomLift platform data). Exterior work is 3%, photo edits 3%, and custom or moodboard-driven generations 2%. Video is about 2.6% of all generations. Set against Wyzowl's finding that 91% of businesses use video as a marketing tool, that share is small, which suggests most listings still stop at the photo stage.
Usage intensity varies more than any other metric. Property developers generate roughly 9x more images per active user than homeowners, about 6x more than real estate agents, and around 14x more than interior designers (RoomLift platform data). Real estate agents generate about 1.4x more per user than homeowners and roughly 2x more than interior designers. The pattern is simple: the more units someone has to market at once, the more they generate.
How was this data collected?
The platform figures in this report are RoomLift platform data covering the 12 months to September 2026. The dataset includes more than 10,000 AI-generated images and videos. Each percentage is the share of generations where the relevant field (style, room type, edit preset or generation type) was set, so the tables describe requests, not sale outcomes. The data covers RoomLift users only and is not a market survey. Market figures are quoted from the published source named in each line, listed in full under Sources & References.
Want your listings in the 60% that get staged Modern or Scandinavian? Stage a listing photo on RoomLift in under 60 seconds.
Stage your first room in 20 seconds. No design skills needed.
What do these virtual staging statistics mean for agents?
Stage the living room first and the bedroom second. NAR's finding that 46% of buyer's agents name the living room the most important room to stage and RoomLift's 30% living room share point at the same room. Default to Modern or Scandinavian unless the property argues otherwise, since 60% of staging requests already land there (RoomLift platform data). Then fill out the photo set: Zillow research finds listings with 22-27 photos get the most buyer engagement, and one staged hero shot in a set of eight won't get you there. At about $1-5 per image (RoomLift), staging five or six rooms is a rounding error against a commission, which is what virtual staging for real estate is built for.
What do these virtual staging statistics mean for photographers?
The edit demand table is a price list waiting to happen. Declutter (28%), virtual twilight (13%) and golden hour (13%) are the three edits agents ask for most (RoomLift platform data), and all three can be sold as add-ons to a standard $150-400 shoot (RoomLift). Photographers typically bill $25-75 per virtually staged room while the AI image costs about $1-5 and takes under 60 seconds (RoomLift). Since 59% of staging requests are living rooms and bedrooms (RoomLift platform data), a two-room staging bundle covers most of the demand with a single line on the invoice. Our guide to how much virtual staging costs lays out the price gap in more detail.
What do these virtual staging statistics mean for designers?
Interior designers are the lightest users per head, generating under half as many images per active user as real estate agents (RoomLift platform data). That fits how designers work: one concept, one client, a few variations. Modern and Scandinavian are what the market defaults to, but Japandi (11%), Boho (7%) and Traditional (6%) are where a designer's point of view shows up. At about $1-5 per image against $200-500 for a traditional render (RoomLift), a designer can show a client three directions in one meeting instead of one direction in three weeks.
Frequently Asked Questions
What percentage of buyers say staging helps them picture a home as their own?
81% of buyers say staging makes it easier to picture a property as their own, according to the NAR Profile of Home Staging. The same report found 23% of buyer's agents saw a 1-5% increase in the dollar value offered for staged homes, and 18% saw 6-10%. Staging changes both how a buyer feels and what they offer.
Do staged homes sell for more money in 2026?
Yes, by a modest but consistent margin. The Real Estate Staging Association reports staged homes sell for 1-5% more on average, and in some markets spend 33-50% fewer days on market. On a $400,000 home, a 1-5% lift is $4,000 to $20,000.
What is the most popular virtual staging style in 2026?
Modern, at 31% of staging requests, with Scandinavian close behind at 29% (RoomLift platform data, more than 10,000 AI stagings in the 12 months to September 2026). Together the two styles account for 60% of all requests. Japandi (11%) and Urban Chic (10%) are the only other styles above single digits.
Which rooms get virtually staged most often?
Living rooms (30%) and bedrooms (29%) make up 59% of all rooms staged on RoomLift, with kitchens third at 10% (RoomLift platform data). That matches NAR's finding that 46% of buyer's agents call the living room the most important room to stage. Dining rooms, common in physical staging, are only 4% of AI stagings.
How much does AI virtual staging cost compared to traditional staging or rendering?
AI virtual staging costs about $1-5 per image and takes under 60 seconds, while a traditional render costs $200-500 (RoomLift). Photographers typically bill $25-75 per virtually staged room, so the margin on each image is large. Physical staging is priced per room and per month, and sits in a different budget line entirely.
Where does the RoomLift virtual staging data come from?
It is RoomLift platform data covering more than 10,000 AI-generated images and videos in the 12 months to September 2026. Each figure is the percentage of generations where that field (style, room, preset or generation type) was set. It describes RoomLift users only and is not a market survey.
Sources & References
- National Association of Realtors (2025). Profile of Home Staging. NAR Research.
- National Association of Realtors. Research and Statistics. NAR.
- Real Estate Staging Association. Home Staging Statistics. RESA.
- Zillow. Zillow Research. Zillow Group.
- Royal Institution of Chartered Surveyors. RICS. RICS.
- Wyzowl (2026). Video Marketing Statistics. Wyzowl.
- RoomLift (2026). RoomLift platform data, 12 months to September 2026, more than 10,000 AI-generated images and videos. Internal dataset, percentages only.
Ready to transform your listings?
Stage your first room in 20 seconds. No design skills needed.